Moving from Google Analytics to GoatCounter: 6 months later
Last year (2021) I decided to add GoatCounter as the analytics tool for my blog. There were a couple of reasons why I did it, but the main one is privacy. I am trying to move a bit away from Google, and I wanted something different.
Since I installed GoatCounter, I haven’t removed the tracker from analytics and now I have enough data (6 months) to analyze the differences between both of them, what to expect moving forward and fully remove the Google Analytics counter from my website.
I analyzed the period between 13 July 2021 to 13 January 2022.
Where are people coming from?
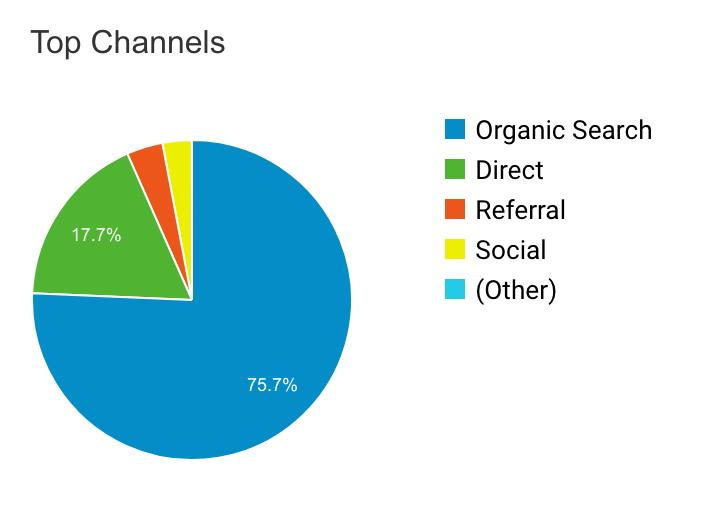
The first metric I looked is where the requests are coming from. Google offers several ways to visualize and download the data. As you can see in the chart below, the vast majority of requests (>75%) are coming through organic search with direct requests (people that are typing the link to the website) in second (17.7%). Google Analytics missed where a couple of requests came from, but in the overall statistics, it knew about 100% of the request origins.
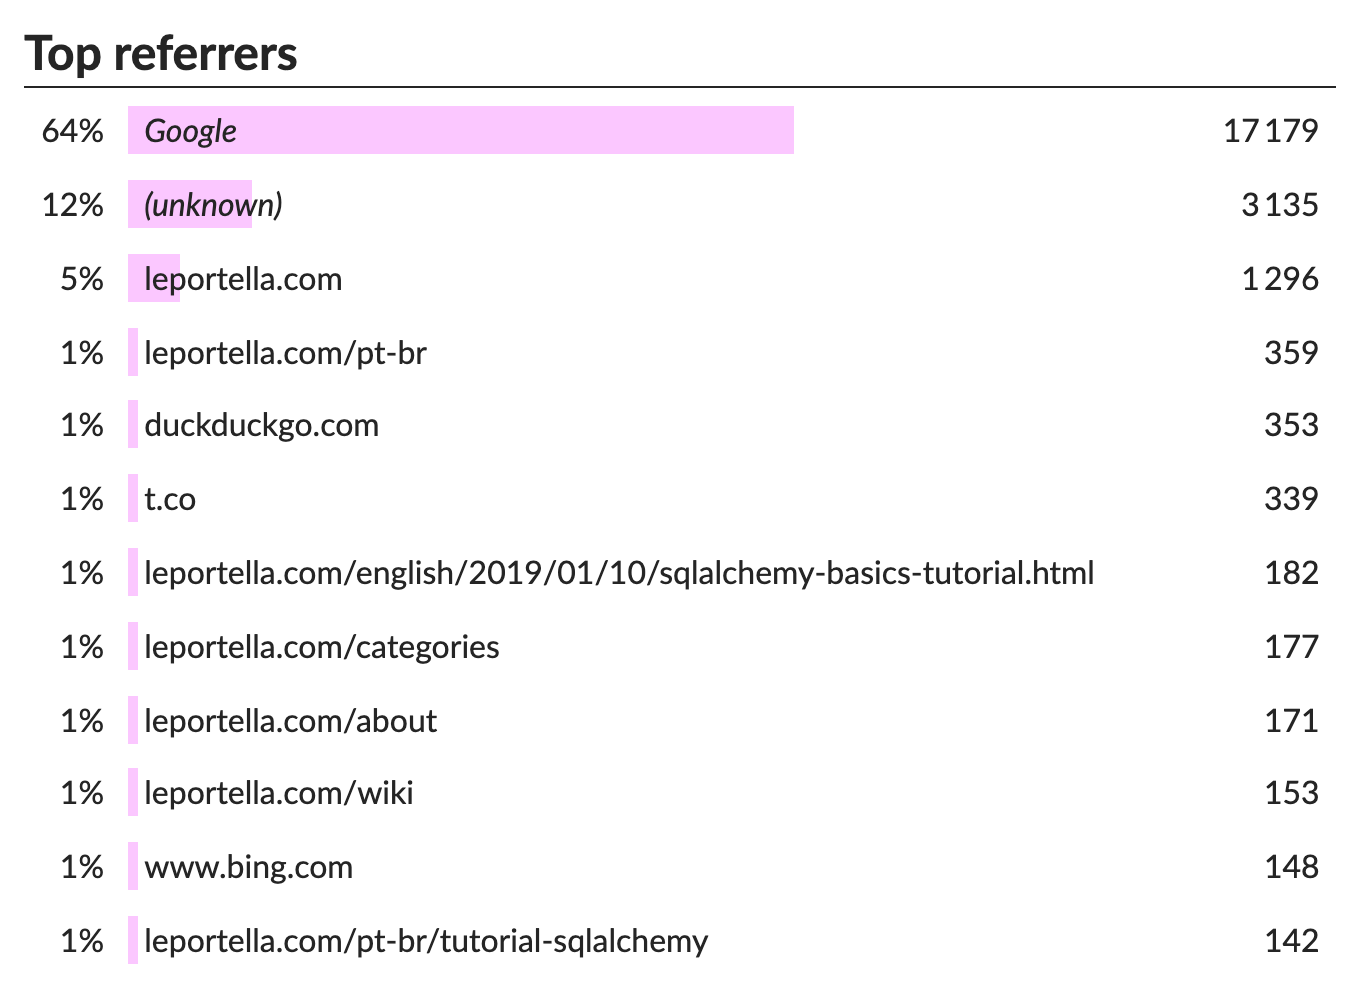
GoatCounter shows a list of referrers, instead of the synthetic data. This was not useful to compare with the data from Google so I copied the data and classified it by myself.
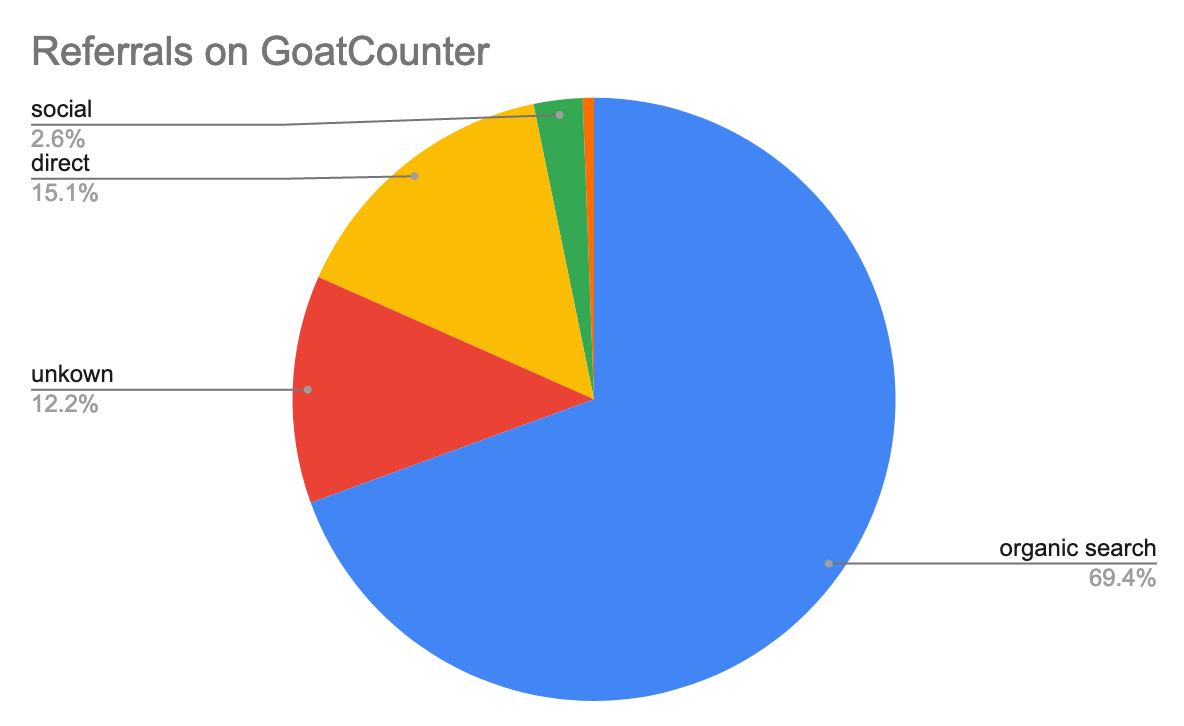
As you can see, GoatCounter confirms that the vast majority of requests (>69%) are coming from organic search, and in second place comes requests that came directly to the website (15.1%). The major difference is that the number of unknown origins became really high (>12%).
So moving from Google Analytics this is the percentage results:
| Type | Google Analytics | GoatCounter | Difference (moving to GoatCounter) |
|---|---|---|---|
| Organic Search | 75.7% | 69.4% | -6.3% |
| Direct | 17.7% | 15.1% | -2.6% |
| Referral | 3.7% | 0.6% | -3.1% |
| Social | 3% | 2.6% | -0.4% |
| Other | 0% | 12.2% | +12.2% |
GoatCounter kept the tendencies of sources of requests (majority of organic search followed by direct requests).
The major differences was the unknown requests, which could be explained by the privacy part of this project, since they don’t keep data from the user and thus, have less data to infer from.
How many times people are accessing it?
Google has the concept of Users, that refers to unique people accessing the website. GoatCounter only has the concept of sessions, so we can only compare with that. Google Analytics offer some cool things like number of sessions per user, number of pages per session and how long people spend in each session. This last number is pretty low, so maybe people are not really reading the blog even though they are accessing it 😅

Data from GoatCounter is showed only as a chart and two numbers: number of visits (or sessions) and Pageviews. I didn’t go to my database to download the data for further analysis, but I could.

So I analyzed the total number of sessions and page views during the 6 months. GoatCounter counted 10% more sessions than Google. This makes sense to me because people that use AdBlockers and anti-tracking tools can be counted by GoatCounter but blocking Google’s tracking system.
However, the interesting metrics is the number of Page Views, which is 10% lower. I have no idea on why this could be happening. I found it absolutely fascinating that the metrics change in exactly same amount but opposite directions! It feels like that it could be the same reason, but … I don’t know.
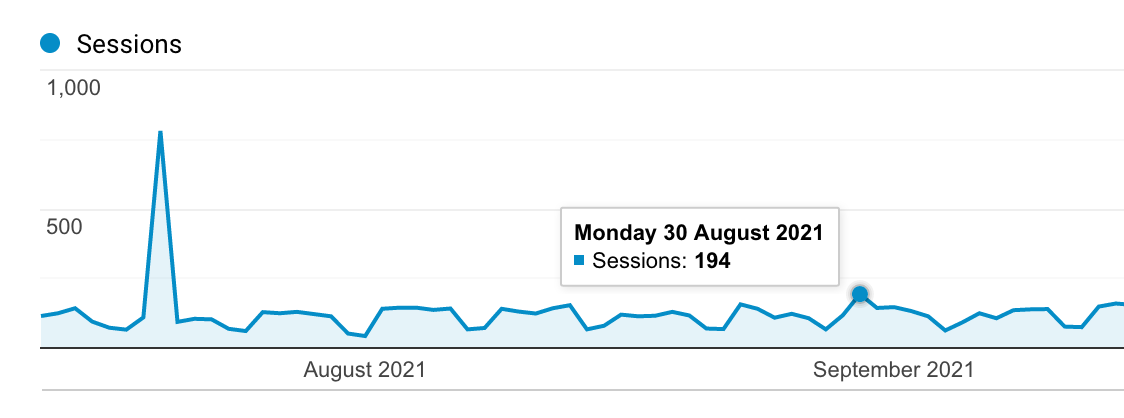
I also looked at one day only metric. In GoatCounter, 30 of August was the peak for sessions, with 280 sessions in that day. That was a 44% difference between both of them! Similarly, Google showed a peak day at 20 July and the difference was -80% on Goat Counter.
| Google Analytics | GoatCounter | Moving to GoatCounter | |
|---|---|---|---|
| Number of users | 19711 | - | -100% |
| Number of sessions | 24262 | 26802 | 10.47% |
| Page views | 31300 | 28018 | -10.49% |
| Peak GoatCounter day (30 Aug) | 194 | 280 | 44.33% |
| Peak Google day (20 July) | 781 | 157 | -79.90% |
Overall, I think the general metric is solid, with ~10% difference between them. However, on a single day the differences can be huge!

Where are people accessing from?
I really liked the colored coded world map to show me where the requests are coming from. I can see all metrics I talked before but per country, which is cool.

GoatCounter only show histogram charts, and only for sessions:
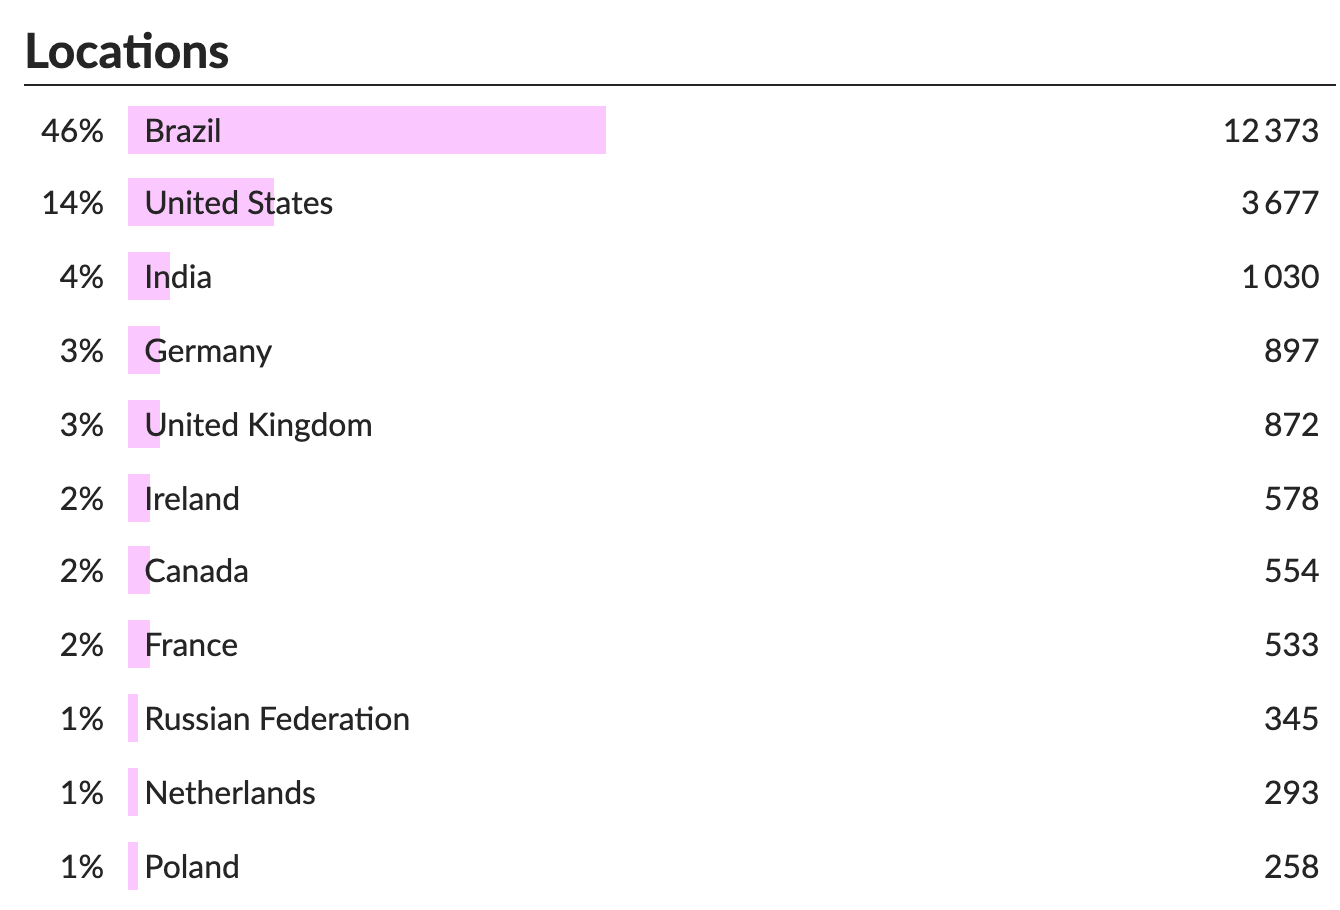
I looked the top 5 countries for each tool, and surprisingly, there’s a lot of difference! We can see an increase of 300% for Ireland and a decrease of 89% for China!
| Google Analytics | GoatCounter | Moving to GoatCounter | |
|---|---|---|---|
| Brazil | 10895 | 12373 | 14% |
| US | 3692 | 3677 | 0% |
| India | 1054 | 1030 | -2% |
| Germany | 616 | 897 | 46% |
| UK | 678 | 872 | 29% |
| Ireland | 145 | 578 | 299% |
| China | 771 | 86 | -89% |
I think this is, by far, the metric I can’t really trust in neither tool. I can imagine that GoatCounter as having a much more privacy-focus mentality, have less tools to define where a session is coming from. But unless that the majority of acesses in Ireland have anti-tracking systems, I can’t really explain the gigantic growth in terms of number. Same with China’s smaller numbers.
Summary
Overall I think GoatCounter was a good tool, and the most important metrics for me (sessions and pageviews) are very close to the number I had from Google Analytics.
I think the thing I will miss the most is the charts and dashboards, that make visualization more interesting. I can do them myself. But since GoatCounter is open-source I could just go and implement them myself, which is also cool.
That’s it for today. Now that I know what to expect… bye Google Analytics 😎
❤Cheers!
Letícia