What to do when data is missing?
AKA magics to plug holes in your dataset

This is the translation of this post in portuguese :)
We can roughly divide any kind of data into two categories: temporal and timeless. Timeless data are quite common in the most commonly used datasets in data science tutorials: such as features of Titanic survivors, flower petal sizes, or tumor characteristics. Data may have temporal data, such as the moment when the user has made a determined attitude, but time is a secondary feature of the data, and not its essence.
When dealing with temporal data, on the other hand, the moment (time) when those data were created are extremely important. Classic examples are dólar value through the day or the number of users per hour in a website.
When a timeless data has missing data, we usually are taught that the simplest way is to remove that data row from our dataset. It is best to remove the data because many algorithms can’t make analysis with missing data and, most cases, the data are abundant enough to have little to no impact on removing a few lines.
When we are talking about temporal data, the removal of a data can be very troubling. These type of data need pattern, specially if we must do a frequency analysis. So, which alternatives we have then? This text is precisely to talk about them :)
All graphics and code are available on this notebook.
Our temporal data
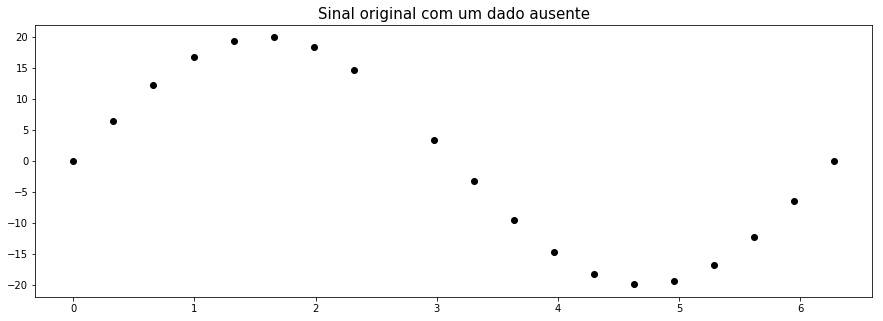
We will use the following data to analyze. We have a pretty simple data that has a senoidal shape. We know, before anything, that this data doesn’t have abrupt variations and that it should be received in regular time intervals. We can see, then, that the nineth element was lost and this is the data we will focus to fullfil.

The original data is in red:

Fill with mean
One possibility is to fill the missing data with the mean value of the whole series. The result is the presented below:

Seems weird, rigth? And it is! Since we know the data general pattern, this alternative is really unsuited. However, this method can be quite usefull depeding on what you have, since the mean of the whole data remains the same.
However, don’t be fooled by it! The mean will not change but the other statistical characteristics may (and probably will) change. Because we are adding another data more close to the mean, the standard deviation tend to be smaller. See:

Interpolation
Interpolation is a mathematical method that adjusts a function to your data and uses this function to extrapolate the missing data. The most simple type of interpolation is the linear interpolation, that makes a mean between the values before the missing data and the value after.
Since our data is a curve and not a line, we have a difference between the real original point and the interpolated point. However, since we have a good idea on how our data should behave, this is a pretty good approximation that solves our problem.

Of course, we could have a pretty complex pattern here and linear interpolation could not be enough. Although I am just showing one type, we have several different types of interpolation, one for each reality you may bump into. Just in Pandas we have the following options: ‘linear’, ‘time’, ‘index’, ‘values’, ‘nearest’, ‘zero’, ‘slinear’, ‘quadratic’, ‘cubic’, ‘barycentric’, ‘krogh’, ‘polynomial’, ‘spline’, ‘piecewise_polynomial’, ‘from_derivatives’, ‘pchip’, ‘akima’.

Interpolation when data pattern is unknown
It is important to say that not all temporal signals have a clear pattern such as that we just saw. So, let’s take a look to a second temporal series.

In this case, we don’t know the pattern and we can’t predict for sure the data that was lost and we can’t predict the low value it actually had. Thus, linear interpolation may not be the best choice:

In this case filling the missing value with the mean value of the series makes more sense! Since no data will actually predict the missing value, the value of the mean will keep the data align to its overall behavior and you get your continuity back. Depending on which kind of analysis you want to do, this could be exactly what you need.

In our case the missing data and the mean have a really close value, but this is not always the case. Imagine if the missing point was the pick in the beginning of the data?
Filling with other data
Another option is to replace the missing data with data that surrounds it. We can, for instance, replace for the previous data. This technique is called Forward Fill because it propagates existent data forward.

We can do the opposite as well, it is called Backward Fill:

Table with statistics of all series:

Which to use?
Hard to say. If your data has a known pattern, probably some kind of interpolation will fit better. However, if the pattern is unknown, I recommend you to evaluate the analysis you want to make and choose the best method for it or the one that gives you the best result :)

Cool references
- Missing value given the mean — Khan Academy
- Comparison of Linear Interpolation Method and Mean Method to Replace the Missing Values in Environmental Data Set
- Multivariate Time-series Similarity Assessment via Unsupervised Representation Learning and Stratified Locality Sensitive Hashing: Application to Early Acute Hypotensive Episode Detection
- Principled missing data methods for researchers
- Missing Data & How to Deal: An overview of missing data
- Missing-data imputation
- A review of missing values handling methods on time-series data